Statistics - Dispersion and probability
Measures of Dispersion
Within statistics, measures of dispersion are used to show the degree of distribution of values, that is, to determine the degree of variability. Combining these techniques with measures of central tendency (mode, mean, median, all presented in the previous article) makes our exploration more reliable. A quick example to reinforce this statement is:
Imagine you are part of a messaging team, for collections, for example. We have a list with the ages of the people to whom the collections will be sent (note that this is already a task for a data team), and the ages range from 18 to 65 years. Considering that the collection service is different for each age group, calculating the average age would not help justify anything, as it does not indicate the degree of data dispersion.
The most commonly used measures of dispersion are:
Quantile
The quantile is a generalization of the median, meaning it is the value below a determined percentage of the data. We can say that the median is a quantile that works with its percentage at 50%. For example, a 20% quartile separates the lowest 20% of values from the highest 80% of the sample, and so on. With numpy, we use the quantile() method, and to define the percentage, we use the parameter q=N%.
Note that this function adopts the 50% percentile as the default, which means it is a median.
Amplitude
The range is the difference between the smallest and largest value in a sample.
Standard Deviation
The standard deviation indicates how far the data points are from the mean. The greater the deviation, the further the values are from the mean; conversely, the smaller the deviation, the closer they are. With numpy, we use the std() method to calculate this deviation.
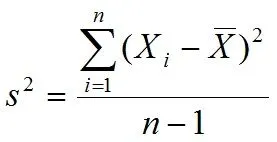
Variance
Variance shows how far our values are from the expected value, meaning that the larger the variance, the further the results are from the mean. With numpy, we use the var() method to calculate variance.
Covariance
We use variance to measure the dispersion of data relative to a single variable, while covariance calculates the dispersion based on two different variables. A covariance of 0 means that the variables are independent of each other. If it is positive, the two variables tend to increase or decrease together; conversely, if it is negative, one variable tends to increase as the other decreases. We use cov() for this measure.
Correlation
Correlation is closely related to covariance. It is used to indicate how strongly one variable is related to another. The closer the correlation value is to 1, the more the variables are related. A value of 0 indicates no correlation, while a negative value signifies an inverse correlation between the variables.
Probability
Probability studies random experiments or phenomena by analyzing the chances of a possible event. The result of a probability calculation can range from 0 to 1, with values closer to 1 indicating a higher likelihood of occurrence.
If we have a deterministic process where we know the rules, we do not use probability in that process. Probability is used in processes with random outcomes or events.Para trabalharmos com probabilidade devemos nos afeiçoar com alguns termos:
Experiment — The process being analyzed. Sample Space — All possible outcomes of the experiment. Event — Results obtained from the experiment.
Mutually Exclusive Events These are values that cannot occur at the same time. For example, when rolling a die, if it lands on 6, it cannot be odd at the same time.
Non-Mutually Exclusive Events These are events that can occur simultaneously. For example, when rolling a die, it can land on 6 (which is even) and still be even.
Dependent Events For one event to happen, another event must occur first.
Independent Events These events do not depend on a previous event to occur.
Thanks, bye!
References
All credits to the original sources for the images used in this document.